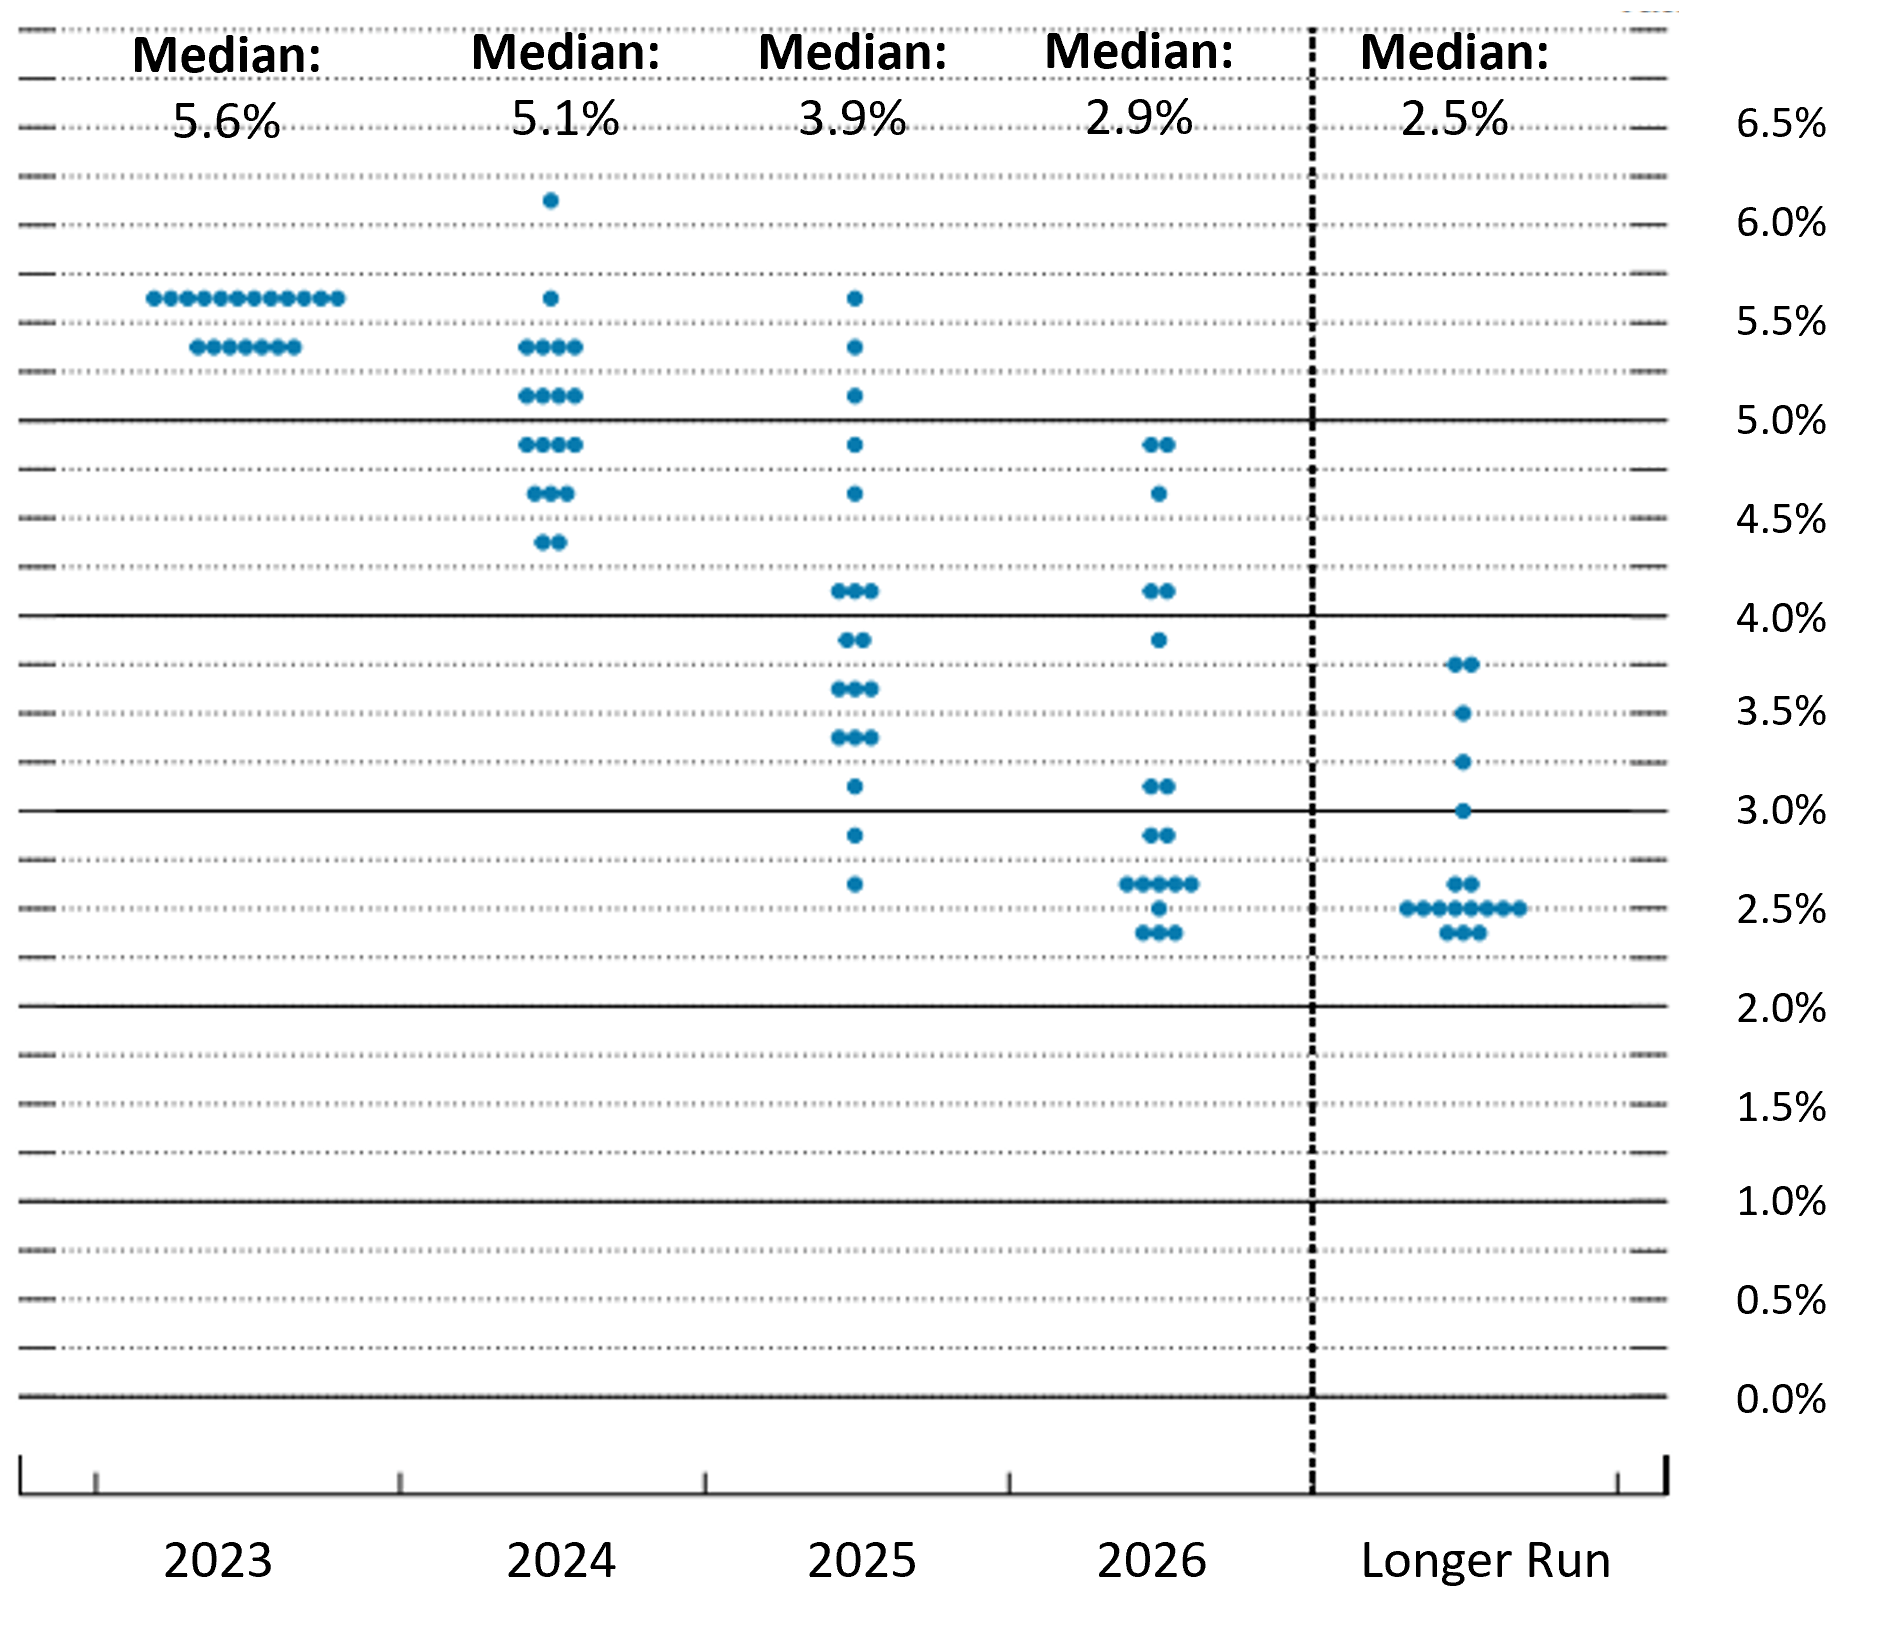
Charting the Fed's Dot Plot
Understanding the FOMC's Interest Rate Projections
What is the Dot Plot?
The FOMC (Federal Open Market Committee) dot plot is a chart that summarizes the FOMC's outlook for future interest rate moves. It displays individual members' estimates for the federal funds rate, which is the short-term interest rate controlled by the Fed.
What's Plotted on the Dot Plot?
The dot plot shows economists' estimates for interest rates at the end of the next several years and over the longer run. Each dot represents the projection of a single FOMC member.


Comments